How to calculate the carbon dioxide emissions of an electric vehicle
Here we present the simplest calculation for working out the environmental benefit of an electric car. Change the numbers to suit your case.
Annual Running Carbon Dioxide Emissions
Estimate the distance your travel in a typical year. To compare with a petrol or diesel car it is best to split this into an urban distance and a extra-urban (or highway) distance.
Let’s say we drive 12 000 km or 7500 miles every year. Let’s say 8000 km or 5000 miles of that is urban driving.
For an electric car we could find out the manufacturer’s technical specification for miles per kWh or km/kWh for that model, or we could check the US EPA database for the vehicle. Let’s say the EPA database gives us 30 kWh / 100 miles (126 mpg equivalent city, 101 mpg equivalent highway and 114 mpg equivalent combined). For this model the EPA database looks representative when compared to real world driving (see measured example at the end of cost article) so no extra pessimism is necessary. The simplest approach is to use 30 kWh / 100 miles * 7500 miles = 2250 kWh.
Then we need to multiply 2250 kWh by the carbon intensity for grid electricity.
We use published figures for the carbon dioxide equivalent emissions for UK electricity grid [1]. This is made up from the carbon intensity of average UK grid electricity supplied (0.207074 kgCO2e/kWh), the transmission and distribution factors for UK grid electricity (0.01792 kgCO2e/kWh, to cover losses between the generator and your home as a result of supplying your power), the Well-to-tank emissions for the primary fuels used to generate your electricity (0.0459 kgCO2e/kWh) and the Well-to-tank emissions for the primary fuels used to generate the electricity lost in transmission and distribution (0.00397 kgCO2e/kWh). The emissions are (0.207074 + 0.01792 + 0.0459 + 0.00397) * 2250 = 618 kg per year = 0.6 tonnes per year.
The carbon dioxide equivalent emissions to continue running the petrol or diesel car now needs to be compared. According to manufacturer technical specifications, a typical mid-sized family car with a small efficient petrol engine (equivalent to the battery electric vehicle analysed above) may achieve 7.0 l/100km (40 mpg) on urban driving and 4.7 l/100km (60 mpg) on extra-urban driving. So to cover 8000 km (5000 miles) of urban road and 4000 km (2500 miles) of highway should use 7.0 l/100km * 8000 km + 4.7 l/100km * 4000 km = 560 l + 188 l = 748 l. Now before we move on, we note that these figures come from before 2018 when real world fuel consumption was typically 10% more than the test cycle value for petrol cars (and 20% for diesels) [2]. 10% more gives around 820 l (litres).
We use published figures for the carbon dioxide equivalent emissions for UK fuels [1]. This is made up from emissions released directly by combustion (2.09747 kgCO2e/l for E10 petrol and 2.51206 kgCO2e/l for B7 diesel), and the Well-to-tank emissions covering all the emissions associated with extraction, refining and transport to get that fuel to the fuel pump for you (0.58094 kgCO2e/l for E10 petrol and 0.61101 kgCO2e/l for B7 diesel).
Emissions for the petrol car are (2.09747 + 0.58094) * 820 = 2170 kg per year = 2.2 tonnes per year.
A hybrid model with claimed fuel consumption of 3.5 l/100km (81 mpg) on urban driving and 3.6 l/100km (79 mpg) on the highway should have used 424 l or probably more realistically 465 l.
Emissions for the hybrid (petrol) car are (2.09747 + 0.58094) * 465 = 1245 kg per year = 1.2 tonnes per year.
A diesel model with claimed fuel consumption of 4.7 l/100km (60 mpg) on urban driving and 3.7 l/100km (76 mpg) on the highway should have used 524 l or probably more realistically 625 l.
Emissions for the diesel car are (2.51206 + 0.61101) * 625 = 1950 kg per year = 2.0 tonnes per year.
Optional: looking at the city/highway split with an electric vehicle
If you wanted to split urban/city driving from highway driving you can do that with the EPA figures. The EPA quote that 1 (US) gallon of gasoline is equivalent to 33.7 kWh. So to convert 114 mpg equivalent back to kWh / 100 miles is as follows: 100 miles / 114 mpg * 33.7 kWh/gal = 29.6 kWh / 100 miles which agrees with the EPA figure of 30 kWh / 100 miles. So the city and highway efficiency figures are 100 miles / 126 mpg * 33.7 kWh/gal = 26.7 kWh / 100 miles and 100 miles / 101 mpg * 33.7 kWh/gal = 33.4 kWh / 100 miles respectively. Our figure is now 26.7 kWh / 100 miles * 5000 miles + 33.4 kWh / 100 miles * 2500 miles = 1335 kWh + 835 kWh = 2170 kWh which actually is pretty similar to the simple method.
Ok so that is emissions for running the car, but what of you include manufacture of the car and battery and so on?
Lifetime Carbon Dioxide Emissions Averaged per Year
It is well known that there are significantly more expensive minerals used in electric vehicles than in petrol or diesel vehicles and that they are mainly used in the battery. The IEA (International Energy Agency) has explored this in a report on critical minerals.
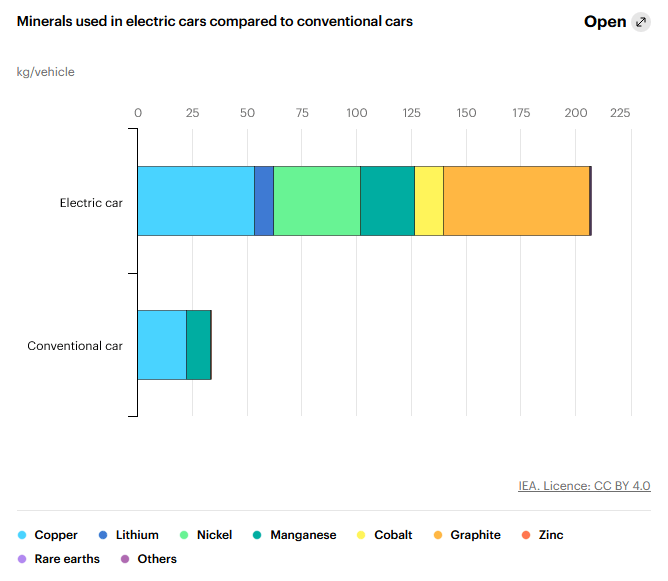
Read more about the minerals in the useful knowledge article. The thing to note here is that this larger use of minerals is expected to be associated with more emissions. A lifecycle analysis of carbon dioxide equivalent emissions was also reported in the same IEA report and this is reproduced below.
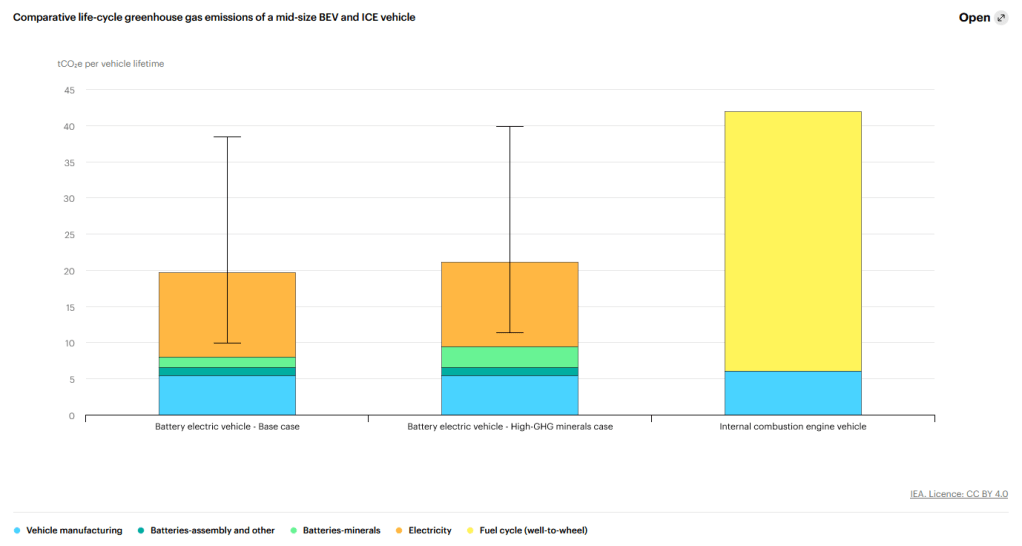
The large error bars in the chart reflect the differences in carbon intensity of the electricity purchased for running the vehicle and this is easily calculated as described at the beginning of this reference article (electricity produced by coal will be the highest emissions at the top of the bar and that produced by wind will be among the lowest emissions at the bottom of the bar). What we are interested in is the differences in emissions as a result of vehicle manufacture, battery manufacture and battery minerals mining and refining. The data from the IEA report is extracted here:
| Category | IEA battery electric vehicle base case (tCO2e) | IEA battery electric vehicle high emissions case (tCO2e) | IEA conventional vehicle case (tCO2e) |
|---|---|---|---|
| Mineral mining/refining | 1.4 | 2.8 | 0.03 |
| Battery manufacture | 1.2 | 1.2 | 0.01 |
| Vehicle manufacture | 5.4 | 5.4 | 6 |
| Total manufacture | 8 | 9.4 | 6.04 |
To get overall emissions we add the manufacturing emissions to the annual running emissions calculated earlier. We’ll make the assumption that the emissions for charger, consumables, repair and all services (including professional services) are the same for each vehicle type and exclude these from the analysis. So what is the life of the car? A basic internet search gives us 150 000 miles (240 000 km) for a petrol vehicle and 200 000 miles (320 000 km) for a battery electric vehicle. The reason given is that the electric vehicle drive train is simpler mechanically so the life is expected to be based on battery longevity, not engine or gearbox life.
For our example of 7500 miles a year, the lifetime could be 20 years for the petrol car and 26 years for the electric car (which would be good since internet searches generally give 15 years and up to 20 years in time rather than distance).
| Emissions Category | Battery Electric Vehicle (tCO2e) | Petrol Vehicle (tCO2e) | Hybrid Vehicle (tCO2e) | Diesel Vehicle (tCO2e) |
|---|---|---|---|---|
| Battery minerals | 1.4 | 0.03 | 0.3 | 0.03 |
| Battery manufacture | 1.2 | 0.01 | 0.25 | 0.01 |
| Vehicle manufacture | 5.4 | 6.0 | 6.0 | 6.0 |
| Running emissions per year | 0.6 | 2.2 | 1.2 | 2.0 |
| 10 year total | 14 | 28 | 19 | 26 |
| Life (years) | 20 years | 15 years | 15 years | 15 years |
| Lifetime emissions per year | 1.0 | 2.6 | 1.7 | 2.4 |
The table shows that the greenhouse gas emissions of electric motoring in the UK is significantly lower than for a comparable petrol, diesel or hybrid car over 10 years for the case of 7500 miles travelled a year. The expectation of a longer lifetime for an electric vehicle further improves the benefit.
Out of curiosity the c.£1000 per year spend on consumables, repair, services and insurance (see cost article) also has an emissions footprint. We could roughly estimate this by looking at the ratio of total UK emissions to total UK GDP. In 2019 this ratio was 0.16179 kgCO2e/£, meaning we might expect around 0.1 to 0.2 extra tonnes per year of greenhouse gas emissions for all vehicle types.
Do I reduce my emissions if I use Green Electricity?
Yes. But it isn’t zero. If you can directly trace your electricity to the green generator then your indirect emissions will be lower (this is a “deep green” supplier). If you use your own solar generation then your emissions will be lower.
Using 100% offshore wind (via a Power Purchase Agreement with a “deep green” tariff) will result in one of the lowest emissions possible today. For electricity we will take account of lifecycle carbon emissions from the generator and add to that the transmission and distribution factors for UK grid electricity. The Intergovernmental Panel on Climate Change (IPCC) have previously published carbon dioxide emission intensity data [3]. The WTT for the primary fuel for renewables that use the sun, the wind or the waves is zero. If we purchased offshore wind (median lifecycle emissions of 12 gCO2e/kWh) then the emissions are (0.012 + 0.01792 + 0 + 0.00397) * 2250 = 76 kg per year = 0.08 tonnes per year.
Using 50% self-generated solar and 50% grid electricity will also help. For the 50% which is self-generated we can save on the grid losses. For 50% rooftop solar (median lifecycle emissions of 41 gCO2e/kWh) [3] then the emissions are (0.041 + 0 + 0 + 0) * 1125 + (0.207074 + 0.01792 + 0.0459 + 0.00397) * 1125 = 355 kg per year = 0.36 tonnes per year.
As the UK grid continues to decarbonise (which it will), the emissions from the electricity will continue to fall.
The best way of minimizing the carbon emissions associated with your vehicle is to use an electric vehicle powered by renewable electricity.
Other Emissions Considerations
- Pollution and air quality. Low emission zones are becoming increasingly popular in cities in the UK and EU. They are primarily aimed at improving air quality for health reasons since automotive exhausts remain one of the most significant urban health hazards. Emission standards, such as EURO 6, limit the quantity of carbon monoxide, unburnt hydrocarbons, non-methane volatile organic compounds, oxides of nitrogen and particulate matter (fine dusts). A battery electric car will not release emissions from combustion and will have lower levels of brake dust if using regenerative braking, but tyre wear dust could be a future concern even though the standards today do not seem to put a limit on it.
- Lifetime embedded emissions. Average emissions from mineral sourcing and manufacturing were looked at above. The actual emissions will be linked to the carbon intensity of the supply chains and factories and we can influence that with our choice of car. It is not too difficult to ask where it is made and check the carbon intensity of the local electricity grid. It might be possible to find out what battery it is and how carbon intensive that is and maybe, just maybe, you might get a response if you write to ask where the minerals were mined or processed. Easier is to look to purchase a car with a longer life. Look out for models with long warranties.
Click here to see how to calculate the cost of an electric car.
Click here for an overview of some useful electric car knowledge.
[1] UK Government GHG Conversion Factors for Company Reporting, June 2023, https://www.gov.uk/government/publications/greenhouse-gas-reporting-conversion-factors-2023
[2] “Mind the Gap! Why official car fuel economy figures don’t match up to reality”, Dings J (Ed.), Transport and Environment, March 2013, available at https://www.transportenvironment.org/
[3] Intergovernmental Panel on Climate Change (IPCC) 2014 carbon intensities: https://www.ipcc.ch/site/assets/uploads/2018/02/ipcc_wg3_ar5_annex-iii.pdf, p.7
