“Hot tea or cold tea? – kitchen science”
Suitable for Key Stage 2 (ages 7 to 10) and Key Stage 3 (ages 11 to 13)
Skills: Measurements, Comparisons and optionally Graphing.
This reminds us of the scientific method and how to set up a science experiment. It is suitable for being done at home under parental supervision.
Heat loss of materials: hot tea or cold tea?
The questions we want to test are whether insulating a cup makes a difference to how it retains its heat and whether there is any difference between wet and dry insulation.
Let’s remind ourselves of the scientific approach.
An experiment is made up of a “hypothesis” or question for testing, then thinking about how to test it (“method”) and carrying it out taking observations or “results”. Finally from the results we find out what the answer to the question is (“conclusion”).
Let’s form a hypothesis here as something similar to “insulating a cup of tea will slow down its cooling”. You could try and guess whether wet or dry insulation will be superior: “wet/dry insulation keeps hot water hot for longer”. The hypothesis doesn’t need to be right but we need to be able to test it. We will work out whether it is right at the end.
Ask the scientist to guess whether wet or dry insulation is better at keeping things hot. Tell them the purpose is to check the guess, so not to worry about whether they know the answer.
Apparatus (what we need):
- A kettle
- At least two identical cups or mugs
- Two identical tea towels and two pegs or strong elastic bands to secure them in place
- A stopwatch or clock
- A thermometer (ideally an infrared medical thermometer that has a surface temperature mode, or a traditional kitchen thermometer). You can still perform the experiment without a thermometer but we will need one if we want to produce graphs at the end. If you don’t have a thermometer you might choose to make tea with a tea bag in each mug or cup for an adult to test after 10 minutes.
- Optionally a small bowl or small pan for the cold water bath test.
Method
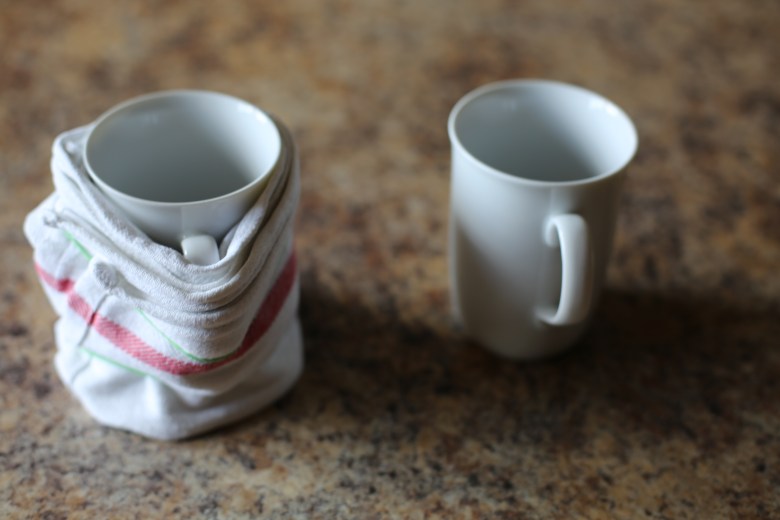
This experiment works best if we can find at least two identical cups or mugs. Here we will use four.
Cup #1. One cup shall be what we call our “control”. This will cool down in air. This is our normal cup of tea.
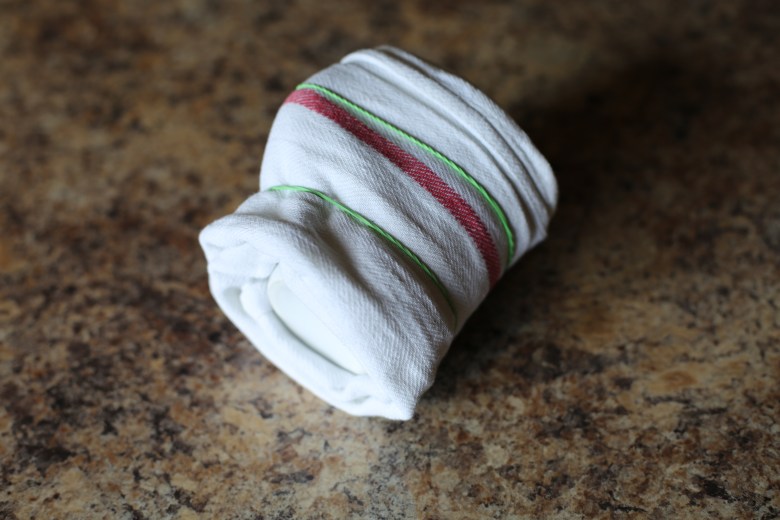
Cup #2. We will try and insulate this by wrapping a dry tea towel round it. Fold the tea towel so it is the same width as the height of the cup and then wrap it carefully round and peg it or tape it or hold it with an elastic band or two.
Cup #3. We will try and insulate this by wrapping a soaking wet tea towel round it. It is best if we have a similar tea towel to the dry one so we will know that any difference in results is only because of the water in the towel.
If you have other cups you can add more experiments. Try putting one cup into a bowl of cold water, making sure the water doesn’t reach the top of the cup. You could try foodstuffs in other bowls too if you want to try other cups or want to repeat the experiment later with a twist. For example, what happens to the cooling rate if the cup is surrounded by dry rice? You can be creative with the food cupboard but remember to ask permission because you may wet the foodstuffs and then you will need to use them afterwards.
Cup #4. In this experiment example we will put the cup into a pan of cold water.
Before we start we need to consider how we are going to measure the cooling in a fair way. You may have a kitchen thermometer. You may have a medical infrared thermometer. A number of the modern thermometers for measuring body temperature or fever also have a surface temperature mode. If you have one of these then you need to think about where you point the thermometer to on each cup so you have a repeatable method. In this example we use a medical infrared thermometer (usually used for measuring your forehead) in surface temperature mode and point that to a small 1cm circle just above the handle on each cup. Our thermometer shows a glow of blue light to help us always measure in the same place. See the photographs below. It is quick to measure a temperature with one of these so you can cool 4 cups at the same time and use the same thermometer.
If you are using a traditional thermometer then be aware that it takes time to register a reading so if you only have one of these then you may need to run each cup one after another (cool cup #1 first, then start again with cup #2 and so on). That will take a little longer. If you have a thermometer in each cup then you can cool down cups together.
Don’t panic if you don’t have a thermometer. We can borrow a tea-loving adult to be our expert taster. Put a tea bag in each cup for the experiment (sorry, no milk). After ten minutes of cooling we can ask an adult to carefully sip each tea and make them judge which is the hottest and which is the coldest. Or the adult can carefully dip their finger in each cup after around 20 minutes if they don’t like tea. But be very careful because some cups may still feel very hot!
Once you are happy how you will take the measurements it is time to start. We set up the four mugs (one on its own, a second wrapped in a dry tea towel, a third wrapped in a soaking tea towel, a fourth in a small pan of cold water). You may need to put each of them on a separate plate to keep your work surface dry. Make sure each has that temperature measurement zone accessible for the infra-red reading.
Boil enough water for all four cups at once and pour them to the same level in each cup. Start with cup 1 and end at cup 4. Start the stopwatch. Measure the temperature immediately in order cup 1 to cup 4 and note them down. Keep the same measurement order as you poured the cups in the first place. This is the fairest way of keeping to time.
If you want to be super impressive then also measure the background temperature during the experiment. This could be done on a fifth empty cup!
Every 2 minutes start the temperature measurement sequence again – cup 1 to cup 4 and note them down.
If you are measuring on the outside of the cup you may find that the temperature doesn’t start off at 100°C, even when the water inside has just been boiling. While you might find that a little disappointing for this experiment, it is actually fairly good that the outside of a cup doesn’t get so hot. Why is this good?
Keep measuring for around 30 minutes if you want to get a nice cooling curve. The temperatures after 30 minutes should be sufficiently different to come to a conclusion about which cup is the best at insulating and which is the worst. You can carry on if you like, but after around 60 minutes you will probably get to water that feels cold to the touch.
Which cup is the best insulator? Which cup kept the tea or water hotter?
Which is the worst? Which cup had the coldest tea or water?


Results
If you didn’t have a thermometer then ask your assistant adult to rank the tea or water from hottest to coldest.
If you have been keeping a record of the temperatures then you may get a set of results a little like the following. Note that you may start from a higher or lower temperature depending how you measured temperature. A traditional thermometer measures the water temperature directly, whereas an infrared thermometer pointing at the outside measures a lower temperature because there is a difference between the water temperature and the temperature of the outside of the cup. The things that affect the temperature you measure are where exactly on the outside you measure, how full the cup is, what the cup is made of and how thick it is. Checking some of these would be another science experiment – have a go later if you want to. The important thing to note is that as long as we measure in the same way for all our cups, we will be able to use these results to compare the temperatures and decide which one is hotter.
We recorded these temperatures. If you didn’t have a thermometer then you can use this table for the graphing part of the experiment.
Record your temperatures in a table
| Time (min) | Cup 1 T (degC) | Cup 2 T (degC) | Cup 3 T (degC) | Cup 4 T (degC) | Ambient T (degC) |
| 0 | 64.2 | 66.6 | 66.7 | 50.9 | 21.8 |
| 2 | 65.3 | 66.1 | 62.6 | 62.2 | 21.9 |
| 4 | 62 | 63.3 | 57.6 | 55.4 | 21.8 |
| 6 | 57.5 | 61.3 | 54.7 | 49.2 | 21.8 |
| 8 | 56.3 | 58.1 | 51.6 | 45.5 | 22 |
| 10 | 53.7 | 56.9 | 49.6 | 42.3 | 22 |
| 12 | 52.3 | 54.1 | 49 | 40.4 | 22 |
| 14 | 50.7 | 53.2 | 47.1 | 38 | 22 |
| 16 | 49.6 | 51.9 | 44.9 | 36.1 | 22.1 |
| 18 | 46.9 | 50.4 | 44 | 34.7 | 22.2 |
| 20 | 45.7 | 49.4 | 42.8 | 33.6 | 22.3 |
| 22 | 44.8 | 48.6 | 41.8 | 32.7 | 22.3 |
| 24 | 43.3 | 47.5 | 40.8 | 31.7 | 22.3 |
| 26 | 43 | 47.4 | 39.3 | 30.9 | 22.4 |
| 28 | 41.1 | 46.1 | 38.5 | 30 | 22.5 |
| 30 | 40.4 | 45.9 | 37.6 | 29.6 | 22.5 |
| 32 | 40.2 | 44.3 | 36.9 | 29 | 22.5 |
| 34 | 39 | 43.6 | 36.2 | 28.5 | 22.5 |
| 36 | 38.2 | 42.8 | 35.3 | 28.1 | 22.5 |
| 38 | 37.6 | 42.1 | 34.5 | 27.9 | 22.5 |
| 40 | 36.8 | 41.3 | 34.1 | 27.8 | 22.5 |
| 42 | 36 | 40.8 | 33.6 | 27.5 | 22.5 |
| 44 | 36 | 40.2 | 33 | 27.2 | 22.8 |
| 46 | 34.4 | 39.5 | 31.9 | 27.2 | 22.3 |
| 48 | 34.3 | 39.1 | 31.7 | 27.1 | 22.6 |
| 50 | 34.3 | 39 | 31.7 | 26.9 | 23 |
| 52 | 33.9 | 38.4 | 30.9 | 26.6 | 23 |
| 54 | 33.4 | 38.4 | 30.3 | 26.5 | 22.8 |
| 56 | 32.7 | 37.7 | 30.3 | 26.4 | 22.7 |
| 58 | 32.6 | 37 | 29.9 | 26.3 | 22.8 |
| 60 | 32.2 | 37.1 | 29.6 | 26.2 | 22.8 |
Discussion
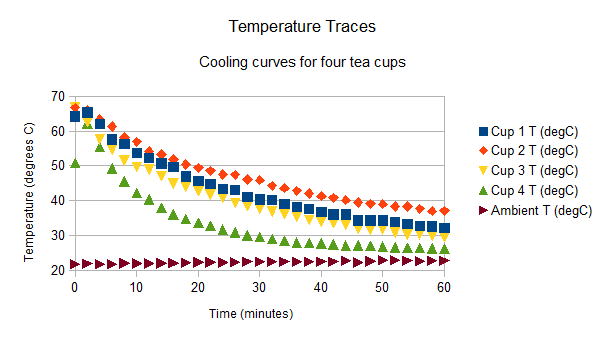
After 20 minutes we can see that hottest to coldest is Cup #2, Cup #1, Cup #3 and Cup #4. In fact we can see that this order is maintained right to the end of the experiment. The hottest cup was that insulated with a dry tea towel. The second hottest cup was our control cup (our normal cup of tea). In third place was the cup insulated with a soaking wet tea towel and the coldest cup was that immersed in a cold water bath.
Optional Graphing
If you have not come across graphs before we recommend to use graph paper or squared paper. If you are familiar with graphs why not try graphing this in a spreadsheet.
On the x-axis (the horizontal axis) we want to put our independent variable (here it is time). On the y-axis (the vertical axis) we want to put our dependent variable (here it is temperature).
If we are plotting by hand it is useful to look at the maximum and minimum values in order to scale the numbers to centimetres so we can plot them on the graph. An A4 piece of paper in portrait orientation could use the scale 1 cm = 4 min, so 60 minutes is 15 cm and every data point is at half a centimetre (a common square size for graph paper). For the temperatures we see that here we did not go above 70 degrees Celsius and our room temperature was just above 20 degrees Celsius. So we could plot 10 degrees every 4 cm (using scale 1 cm = 2.5 degrees Celsius).
Do you get a graph a bit like this?
Conclusion
Think about the hypothesis again and now do you have results to answer it?
Our hypothesis was that “insulating a cup of tea will slow down its cooling”.
The experiment showed that a dry tea towel kept the tea hotter for longer and so did slow down its cooling. However, the experiment also showed that a wet tea towel was worse than no tea towel at all. So insulating a tea cup with a wet tea towel does not slow down its cooling but actually speeds up its cooling. We can conclude that it is important to keep insulation dry to benefit from it*.
* If you are curious, it so happens that trapped air pockets are used in many types of insulating materials. Air is a poor conductor of heat. Wool, fibres, foams, expanded polystyrene, quilts and layers of clothes all trap air and reduce the conduction of heat.
