A guided STEM (Science, Technology, Engineering Mathematics) activity session
Suitable for Key Stage 3 (ages 11 to 13)
Skills: Measurements, Arithmetic, Angles, Averages and an introduction to Trigonometry.
This is a practical STEM (Science, Technology, Engineering and Mathematics) activity that is easily tailored to a specific age group. The purpose is the same: understanding solar panel installations.
Click here for a session designed for ages 7 to 10
Click here for a session designed for ages 14 to 16
Click here for advanced learners
To make the most out of a site visit it is recommended to bring a long sports field tape measure, a large protractor (which could be made in class, especially by slightly older children), a spirit level, a compass and a large scale map (or use Google Maps or equivalent).
The organiser of a site visit would be well advised to conduct a risk assessment. This session is expected to be conducted under adult supervision.
There are some activities in boxes that could be prepared prior to the main activity.
Starting Discussion
You could start off with a similar discussion to (1). However this is a great opportunity to start with looking at the Earth and seasons and the position of the Sun. If you have a globe then this is very useful.
We get maximum power by having our panels directly face the Sun.
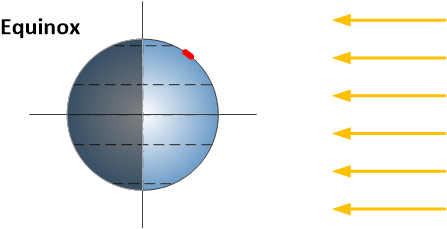
First let’s look at the Sun shining on the Earth when there is no tilt (at equinox = equal day and night). At the equator the Sun is directly above us at midday. As the Earth spins on its axis we get sunrise and sunset. Now still at the equinox (no tilt) we can look at where we live. We see that the Sun “rises in the East” and “sets in the West” as we are moving with the spin of the Earth. We see that the Sun is not directly above us but at an angle in the sky and it is at its peak at midday (not daylight saving time).
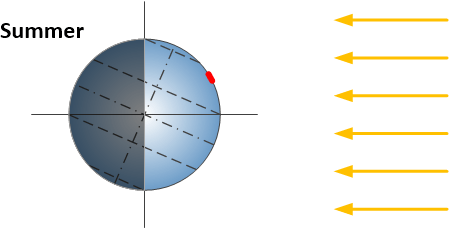
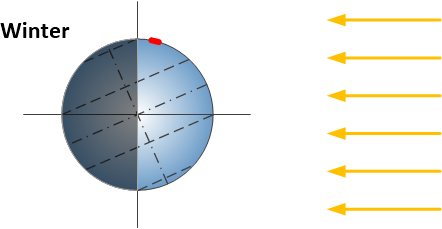
We can then look at the Sun shining on the earth when we are at maximum tilt in midsummer and midwinter. As the Earth spins we can see how the day is longer/shorter and at midday solar time we have the sun higher/lower in the sky.
From this discussion we can look at what this means for the perceived trajectory of the Sun across the sky above our building. Can anyone trace out the trajectory of the Sun using a tennis ball above the building? Where is East and West? What do we as observers on the ground see?
We remind that for maximum power we would like to face the Sun. When the Sun is shining at the edge of the roof we get no direct sun “incident” (at 90° from the “normal”). When the Sun is aligned with the “normal” of the roof (directly facing the Sun at 0° from the “normal”) we have maximum direct sun “incident”. It is the angle between the “normal” and the position of Sun in the sky that gives us how close we are to maximum power.
To collect as much solar energy as possible we want to face the Sun.
But the roof is fixed.
The amount of solar energy we collect depends on
- The angle between the panel and the Sun
- Whether there are objects blocking the Sun (shading)
- How cloudy it is
This discussion allows us to introduce the “Solar Recipe” we will be using in this STEM activity
Solar Recipe
Here is our Solar Recipe to allow us to work out how much solar power we can get from our roof
- Find the Latitude of the Building
- Find the facing direction of the roof (South, East, West)
- Measure the pitch angle of the roof (0° is flat, many houses are around 30-35°)
- Measure the roof area: how many panels can we fit? Typically panels are 1.6m x 1.0m and have peak power ratings of between 250W and 400W
- Look at shading: scan round the building noting direction of blockage (S, E, W), angle of top of blockage from roof (we may need height and distance of blockage)
- Put the numbers in the calculator…
Step 1: Find the Latitude of the Building
How do we find out how far North of the equator we are?
For this we need the help of a map. We can interpret grid references from a map or in the UK we can use the grid reference finder tool on the internet with our postcode.
https://gridreferencefinder.com/
Step 2. Find the facing direction of the roof
Ask how do we know where North is? Can anyone locate North? Can anyone tell us what the angle is between North and this building?
Some smartphones have a compass and most maps show North or we could use a traditional magnetic compass. Stretch question: does anyone know how a traditional compass works? [aligns with the Earth’s magnetic field – but magnetic North pole is not quite the same as the geographic North pole].
We can either use a compass or use a map of the site if that has North indicated. Then we will need a protractor to measure the angle between North and the building.
Step 3. Measure the pitch angle of the roof
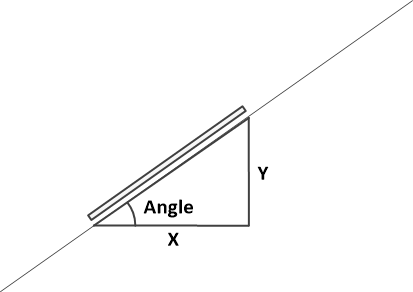
Ask how can we measure the angle of the roof without getting up on the roof. We can look at similar triangles to measure the roof pitch.
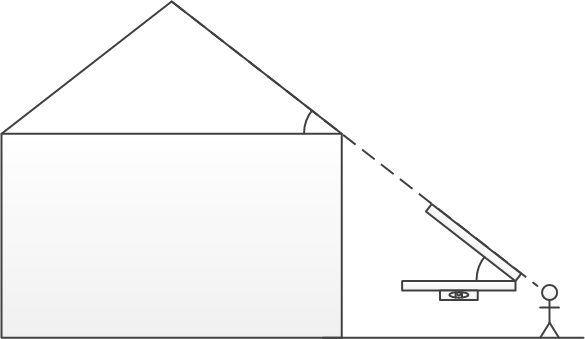
By aligning the roof with our measurement device we can measure the the angle between the measurement arm and a reference level. This reference level could be a spirit level to measure from the horizontal or could be a plumb line to measure from a vertical. If we measure from a vertical then we need to subtract the angle from 90° to give us the pitch angle (use a sketch to explain this).
STEM preparation: making and using a large protractor
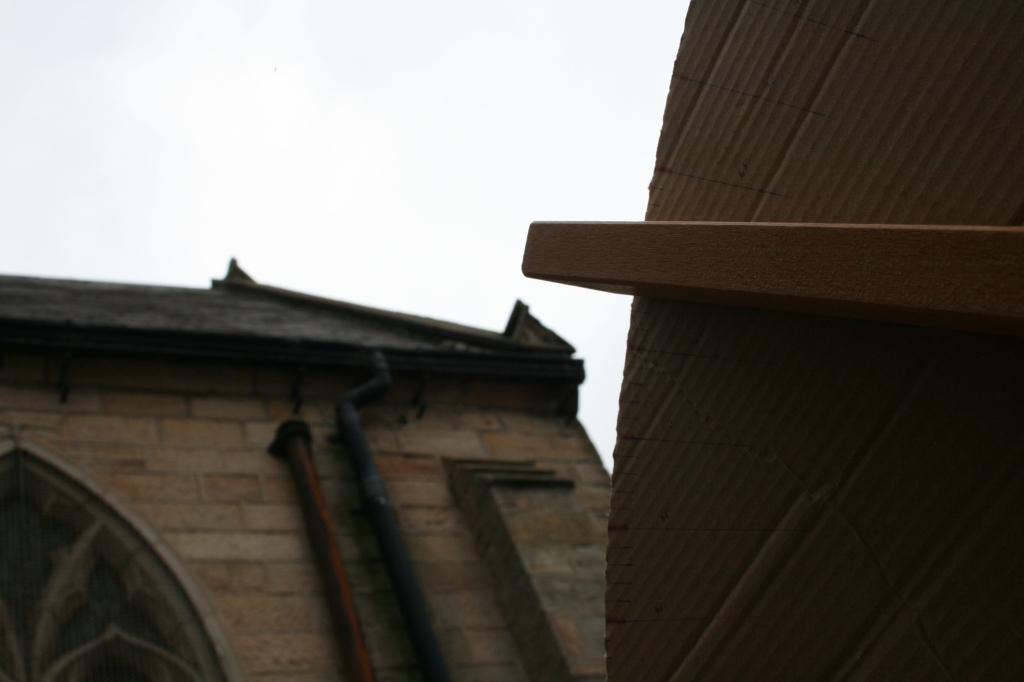
The small protractor in most school geometry sets is quite tricky to use for this. Much better to create a large protractor with a hinged view arm as shown. We attach a spirit level to the bottom arm and rotate the upper arm upwards until we align it with the roof line. A large angle scale is then used to read off the angle. We found this to be a two person activity, with one person concentrating on keeping the bottom arm level and the other concentrating on keeping the upper arm aligned with the roof.

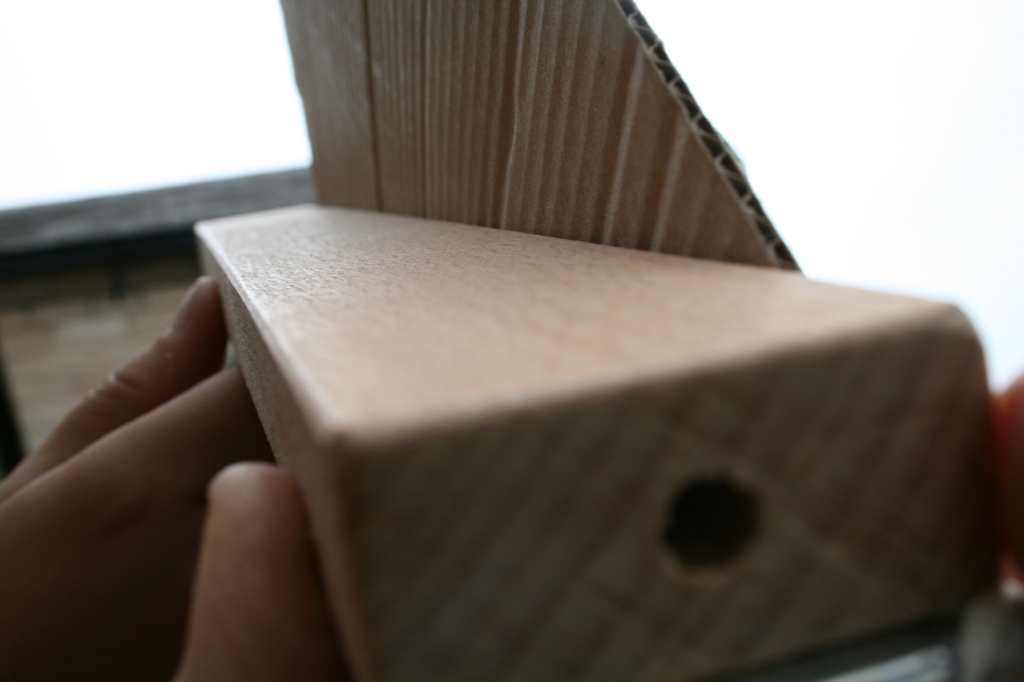


To make this we used two straight pieces of wood hinged at one end and suitably sanded down to remove sharp edges and splinters. The spirit level is simply taped under the lower arm. A cardboard protractor is placed next to the upper rotating arm so we can easily read off the angle.
To make the cardboard protractor we will need a large piece of cardboard, a large compass for scribing a circle, a pen and some scissors. Cut a quarter circle so it looks like a quarter of a cake. To mark the degrees on we will need a large school protractor or we can use a fabric tape measure wrapped around the circular arc and then divide 0, 5, 10, 15, … by 90 and multiply by the tape length to give us the distance around the arc for 0, 5, 10, 15 degrees. Older children or the teacher can instead use trigonometry to mark out the angles with a calculator and ruler.
Optional extension: introducing trigonometry
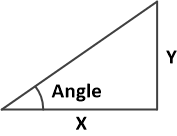
Marking out angles using coordinates. Here we introduce a table showing the coordinates of a point on the circular arc of radius length 1 for different angles.
| Angle (°) | X | Y |
|---|---|---|
| 0 | 1 | 0 |
| 5 | 1.00 | 0.09 |
| 10 | 0.98 | 0.17 |
| 15 | 0.97 | 0.26 |
| 20 | 0.94 | 0.34 |
| 25 | 0.91 | 0.42 |
| 30 | 0.87 | 0.5 |
| 35 | 0.82 | 0.57 |
| 40 | 0.77 | 0.64 |
| 45 | 0.71 | 0.71 |
| 50 | 0.64 | 0.77 |
| 55 | 0.57 | 0.82 |
| 60 | 0.5 | 0.87 |
| 65 | 0.42 | 0.91 |
| 70 | 0.34 | 0.94 |
| 75 | 0.26 | 0.97 |
| 80 | 0.17 | 0.98 |
| 85 | 0.09 | 1.00 |
| 90 | 0 | 1 |
This table is created using trigonometry. X is cos(angle) and Y is sin(angle).
These are the X and Y lengths of a triangle with hypotenuse equal to 1 unit of length. We can check that these work by using Pythagoras’ theorem: X^2 + Y^2 = 1^2 = 1.
Take 40°: 0.77^2 + 0.64^2 = 0.59 + 0.41 = 1.00
You can multiply the numbers in the table by the radius to give coordinates along the circular arc for any size.
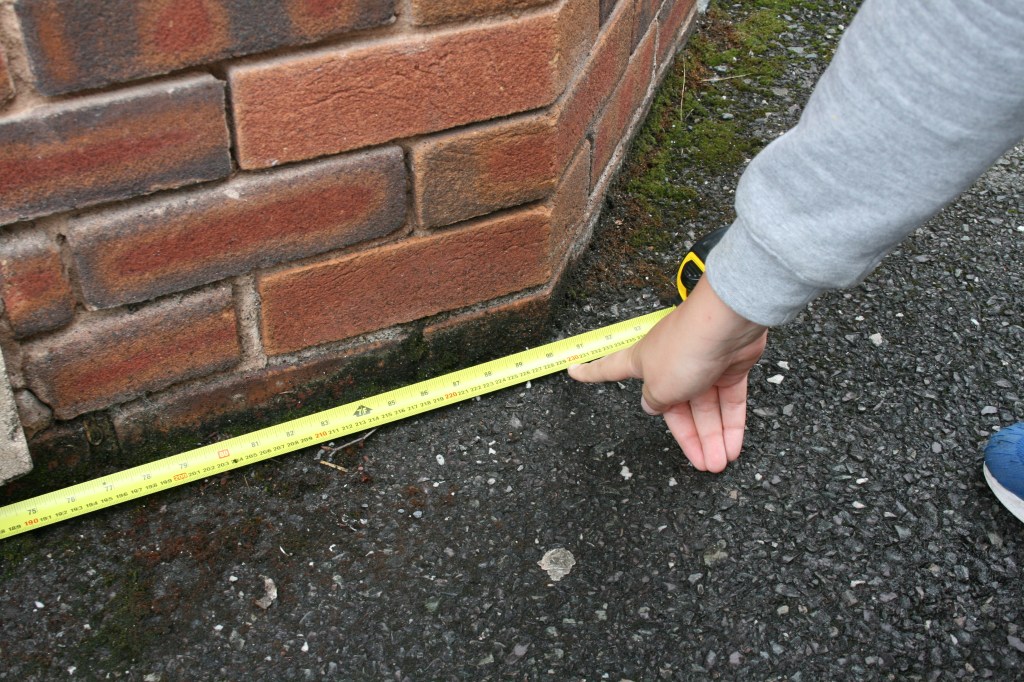
STEM alternative: counting bricks
If your building has walls which are visibly made of regular bricks or blocks then we can measure and count bricks. If we draw what we see on a scale drawing then we can measure the angle on the scale drawing instead using a protractor. Unfortunately we can’t use this technique with every roof – we need to be able to count bricks along and up at a gable end.
Using averages to make brick counting more accurate:
It is recommended to measure five bricks across a number of times on the building in question to get an average brick width (taking into account the mortar thickness) for this building. Repeat this with ten bricks up to get an average brick height for the building. Now when you count bricks you are also measuring lengths and heights! Just don’t forget to multiply your brick count by the brick length or height.
Optional extension: determining the angle from trigonometry
Those that have been introduced at school to trigonometry may wish to use a calculator instead of a scale drawing to determine the pitch angle. First draw a sketch of the roof pitch triangle.
The tangent (tan) of the angle is the ratio of Y/X (maybe you’ve been introduced to “SOHCAHTOA”?). Show that to get the angle we need to find the inverse tangent (tan-1 on most calculators) of Y/X. Remember to check we are using degrees not radians on the calculator for this exercise. For those that have only just been introduced to trigonometry they can satisfy themselves that this works by comparing the angle to a scale drawing using a protractor.
Back to the pitch angle task
Double check: we are looking for an angle measured from the horizontal – so a flat roof is 0°, a shallow roof may be around 20° and a steeper roof could be above 45°.
Step 4. Measure the roof area
For this it is best simply to measure the building area (plan view) using the exterior walls as a guide. Sketch out the plan of the building and on the sketch show what the roof looks like. Mark down chimneys and parts of the roof that cannot be covered (e.g. vent pipes or flush roof windows). Then work around the building measuring each wall length.
From the sketch and the dimensions, produce a scale drawing of the roof. Note that any short overhang of the roof can usually be neglected for this exercise as it is not common to fit panels right down to the gutter (many overhangs or soffits may be around 30cm).
For each roof in turn, what is the plan width and length of the roof. Now that we know the pitch angle of the roof we also know what the roof area is.
Fitting panels
Using a scale drawing of the plan of the roof we can arrange panels on them.
Let’s say our plan is scaled so that 1cm on our drawing represents 1m on our building. This is a 1:100 scale.
If we want to represent the panels on our plan view, we need to be careful of the roof pitch because the slope makes that dimension appear shorter.
It may be a good idea to have sheets of panels already printed that can be easily cut out and placed on the scale drawing.
What size are panels viewed on a plan?
Let’s assume our panels are 1.675m x 1m.
The panel appears shorter on the slope when viewed from the top. We can work out the size on the plan by using trigonometry. The panel on the roof is sloped at the pitch angle as shown. We want a cosine (cos) of the pitch angle to give the ratio of the adjacent horizontal distance and the panel length hypotenuse (remember “SOHCAHTOA”?).
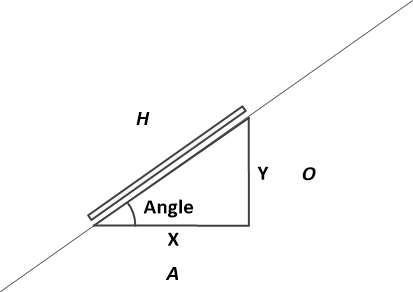
cos(angle) = A / H
So on the plan the slope length H is viewed as A = H * cos(angle).
When we look at the plan view of the roof the panel appears shorter on the slope.
For fitting panels vertically, this is what our apparent plan-view panel size is
| Roof Pitch (°) | Panel size along slope (m) | Panel size along level (m) |
|---|---|---|
| 0 | 1.675 | 1 |
| 5 | 1.67 | 1.00 |
| 10 | 1.60 | 1.00 |
| 15 | 1.62 | 1.00 |
| 20 | 1.57 | 1.00 |
| 25 | 1.52 | 1.00 |
| 30 | 1.45 | 1.00 |
| 35 | 1.37 | 1.00 |
| 40 | 1.28 | 1.00 |
| 45 | 1.18 | 1.00 |
| 50 | 1.08 | 1.00 |
| 55 | 0.96 | 1.00 |
| 60 | 0.84 | 1.00 |
| 65 | 0.71 | 1.00 |
| 70 | 0.57 | 1.00 |
For fitting panels horizontally, this is what our apparent plan-view panel size is
| Roof Pitch (°) | Panel size along slope (m) | Panel size along level (m) |
|---|---|---|
| 0 | 1 | 1.675 |
| 5 | 1.00 | 1.68 (rounded) |
| 10 | 0.98 | 1.68 |
| 15 | 0.97 | 1.68 |
| 20 | 0.94 | 1.68 |
| 25 | 0.91 | 1.68 |
| 30 | 0.87 | 1.68 |
| 35 | 0.82 | 1.68 |
| 40 | 0.77 | 1.68 |
| 45 | 0.71 | 1.68 |
| 50 | 0.64 | 1.68 |
| 55 | 0.57 | 1.68 |
| 60 | 0.50 | 1.68 |
| 65 | 0.42 | 1.68 |
| 70 | 0.34 | 1.68 |
Remember to scale the panel size for your drawing scale. For 1:100 scale we can interpret the numbers in the tables as cm instead of m.
Step 5. Look at shading
If you have time you can look at shading. While on site we can walk around the building and ask what objects might create shade? Children may point out buildings, trees and so on. We’ve had some quite creative answers too: aircraft, clouds and the Moon. The clouds are taken account of with most solar calculators but shading is more specific to a building. Don’t forget about the landscape (hills and mountains).
STEM preparation: making a large compass rose
For noting shading it is handy to have a large circular disc with the cardinal directions of North, East, South and West marked on it along with ordinal directions (NE, SE, SW and NW) and secondary intercardinal directions (NNE, ENE, ESE, SSE, SSW, WSW, WNW, NNW). The greater the number of directions marked out, the better the resolution of shading for the building. With 16 directions, we have 360°/16 = 22.5°. A very fine shading resolution could be 7.5° (48 directions, or split each of our 22.5° sectors into three).
With the North of the large compass rose aligned with true North, look at each of the directions and note the object that is blocking light in that direction. How far away is that object and how tall is it? If it is a tree, is it deciduous or evergreen?
Really we want to assess the shading as though we were at the roof height. So anything lower down we can ignore.
We need to find the elevation angle of the top of the object that is may block the direct sunlight. This helps us decide whether the object does indeed shade our roof. The elevation angle could either be estimated using the large protractor or we could calculate it using trigonometry.

The tangent (tan) of the elevation angle is the ratio of the height above the roof to the distance away from the roof.
Say a tall tree is 20m high and our roof is around 5m high and that tree is 30m away from the building then the tan of the elevation angle is (20-5) / 30 = 15/30 = 0.5. Use the inverse tan (tan-1 on the calculator) of 0.5 to give us 26.6°.
We can appreciate that objects due North of the roof will not shade the roof and objects due South need to be quite high to shade the roof. Smaller objects can easily shade the roof East to South East and South West to West, especially in winter when the Sun has a low elevation angle in the sky. Deciduous trees are often fairly bare in winter as their foliage grows in spring. This means that if the blockage in winter is from deciduous trees then some direct sunlight might penetrate through the branches. In summer the foliage might not block the direct sunlight since the elevation angle of the Sun is much higher.
There is also the shading from objects on the roof itself – most notably chimneys.
Step 6: Calculating the Solar Power potential
Take each roof in turn and describe where the Sun rises in relation to the roof and what its perceived trajectory through the sky is and where the Sun sets. On that path you talk about the shading that is present. You can do this for the longest summer day and the shortest winter day. For this we can use our tennis ball again, this time over a plan of our building. We can see that shading in winter can be quite significant because the angle of the Sun in the sky is fairly low so that other buildings can produce quite a lot of shadow especially at sunrise and sunset.
Note: If you have access to a solar power calculator or online tool then that could be a bonus. However it is better to get the children to think about the discussion points above.