“Bath or Shower? – which uses less water?”
Suitable for Key Stage 2 (ages 7 to 10) and Key Stage 3 (ages 11 to 13)
Skills: Measurements, Comparisons, calculating Volume, introducing the concept of Bias, and optionally Graphing.
This reminds us of the scientific method and how to set up a science experiment. It is suitable for being done at home under parental supervision.
Water used for washing: bath or shower?
The questions we want to test are whether having a bath or shower uses less water in your home.
Let’s remind ourselves of the scientific approach.
An experiment is made up of a “hypothesis” or question for testing, then thinking about how to test it (“method”) and carrying it out taking observations or “results”. Finally from the results we find out what the answer to the question is (“conclusion”).
Let’s form a hypothesis here as something similar to “a bath uses less water than taking a shower in my home”. The hypothesis doesn’t need to be right but we need to be able to test it. We will work out whether it is right at the end.
Ask the young scientist to guess whether a bath or shower will use less water. Tell them the purpose is to check the guess, so not to worry about whether they know the answer.
Apparatus (what we need):
- A bath
- A shower
- A bucket to measure volume*
- A stopwatch or clock
- A tape measure or ruler
* A bucket doesn’t need to be big (big buckets take longer to fill and can get heavy), but it helps for it to be cylindrical if the volume isn’t marked on it. If you are using a big bucket then consider filling it to a pre-set line you mark on it to make it quicker and easier. If it is too small then your measurements are going to be less accurate.
Method
To measure the volume of your normal bath you have two options. 1. estimated (calculated). 2. measured (practical).
1. Estimated (Calculated). Choose this option if you like geometry.
Measure with the tape measure the dimensions of the bath. For a rectangular bath that means the length and width and possibly the radius ends. Then measure the depth to which you would normally fill it. The depth to which you fill it is important to try to estimate well and be careful of under or over-estimation.
Hint: measure in centimetres (cm) so that when you multiply up you get a volume in cubic centimetres. Then you simply divide by one thousand to convert to litres (l).
Bath Volume = Bath Area * Fill Height
2. Measured (Practical). Choose this option if you prefer something practical.
Open the tap the way you typically open it and when you have it running put the empty bucket underneath and start the stop watch. At the same time wait until the bath is drained and then put the plug in. When the bucket is full, split the stop watch and note down the time. Keep the tap running and empty the bucket into the filling bath. When the bath is filled to the right level then close the tap and stop the stop watch.
Bath Volume = (Bucket Volume / Time to Fill Bucket) * Total Time to Fill Bath
If you don’t know the bucket volume then you may need to estimate it using a tape measure and some simple geometry. If you have a cylindrical bucket then
Bucket Volume = 3.14 * (Bucket Radius) * (Bucket Radius) * (Bucket Height)
Remember that Bucket Radius is half the Bucket Diameter.
Now for the shower.
Start the shower and get it to the right conditions you would normally like it: to your normal flow and temperature. Then start a stop watch and time how long it takes to fill your bucket (try to make sure you catch all the water from the shower head in your bucket).
Shower Flow Rate = Bucket Volume / Time to Fill Bucket under shower
Once you have a flow rate now you have the tricky part. You’ll need to take a shower and time how long you normally stay under the shower. Tricky? Why tricky? Because it is completely amazing how timing yourself speeds you up! This is called bias. We are not very good observers of ourselves – when we know we are being measured we’re very likely to change our behaviours! So if there are more than you in your household you could time each other from a distance every so often (from when you hear the shower going on to when you hear it stop). It turns out that once you get used to being timed, you’ll probably get back to your normal showering time. It’s your normal showering time we need for this.
If you normally turn the shower off and soap without constant running water then well done. For this study you will need to have someone else time you based on when they hear the water coming on and going off. The total shower on time is the time we need here.
Optional method step: using statistics
Do you agree that knowing you are timing yourself may affect the result? One way of helping us get a better estimate of time is to keep timing every time you have a shower and keep a table of times. We will see that sometimes it takes us longer and sometimes it takes us less time. But over the longer term we will see some consistency. The bias will affect the first few times most, so it is fair to discount the first week. If you graph your timing you may see this trend in addition to a bit of scatter (points up and down seemingly at random). Take the last 6 to 10 readings (the valid readings) and find the arithmetic mean for them (the average). This is the total sum of the valid readings divided by the number of valid readings. The scatter shows how consistent your timings are. An average from a number of readings is a more reliable measure of time taken than for measuring just once. Can you think why that is?
Shower Water Use = Shower Flow Rate * Typical Shower Time
Results
Write down or calculate the volume of your typical bath
Volume =
Example: my bath is approximately a rectangle of 128 cm long and 46 cm wide, taking into account the radius corners. We use shallow baths of around 10 cm depth. So the volume of water used is approximately 59 litres which we can round up to 60 litres.
Write down or calculate the volume of your typical shower
Volume =
Example: my shower filled a 1.75 litre container in 32 seconds. That means my shower’s flow rate was 0.055 litres per second (or 3.3 litres per minute). If I have a 4 minute and 4 seconds shower then my water usage is 244 seconds multiplied by 0.055 litres per second = 13.4 litres.
If you are doing the optional shower monitoring study then record the times in a table like this
| Day (Sample number) | Shower Time | Shower Volume |
|---|---|---|
| 1 | 4 mins 04 sec = 244 sec | 244 sec * 0.055 litres/sec = 13.4 litres |
| 2 | ||
| 3 | ||
| 4 | ||
| 5 | ||
| 6 | ||
| 7 | ||
| 8 | ||
| 9 | ||
| 10 |
Discussion
Whilst many people have an idea of which uses more water, we can see it is dependent on a number of things: the flow rate of the shower head, the time you spend underneath the shower, the level to which you normally fill the bath.
This experiment has looked at volume of water. The environmental footprint of a bath or shower also depends on how hot a bath or shower you run. Cooler showers and baths use less gas (or electricity) to heat the water up than hotter ones.
Example: the maximum length time in the shower before a bath would have been better option for me would be 60 l / 0.055 l/s = 1090 s = 18 minutes (approximately). So for me a shower uses less water. It turns out that my shower is really low flow compared to most flow rates of new showers on the market. Showers typically range from 4 litres per minutes flow rate to 20 litres per minute (power showers can be around the 10 to 15 litre per minute mark). If instead of a low flow shower I had a strong power shower then I could be looking at a flow rate of 0.22 l/s or 13.2 l/min and the time under the shower before a bath is better would be 60 l / 0.22 l/s = 273 s = 4.5 minutes (approximately). You can see that it is easy to find a case where a shallow bath uses less water than a strong shower.
Optional Graphing
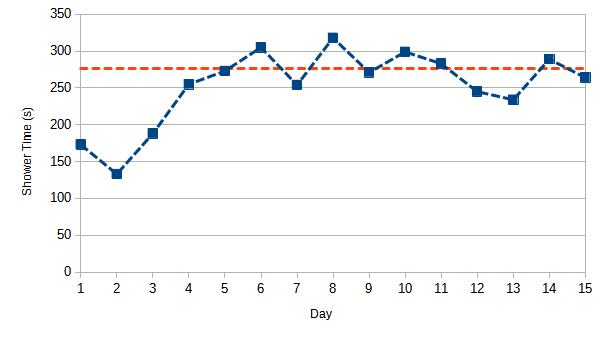
This is recommended if you are doing the optional statistical study. The graph is the best way to see if and when the bias has gone. The timings are “stable” when there is no further trend and the scatter appears around a horizontal mean. If you have not come across graphs before we recommend to use graph paper or squared paper. If you are familiar with graphs why not try graphing this in a spreadsheet.
On the x-axis (the horizontal axis) we want to put our independent variable (here it is sample number). On the y-axis (the vertical axis) we want to put our dependent variable (here it is time under the shower). This type of graph is similar to that used in Quality Control.
Conclusion
Think about the hypothesis again and now do you have results to answer it?
Our hypothesis was that “a bath uses less water than taking a shower in my home”.
Do your measurements support or refute/contradict the hypothesis?
Now you have your answer for your home you can show your parents how to save water (and energy)!

